Data plays a significant role in most modern businesses. It is the driving force behind decisions, but only if you can use it correctly.
With the overwhelming number of data analysis tools on the market, each with its own unique dashboards and target markets, it can be challenging to select the best one for your needs. A mistake doesn’t just mean wasting time on the wrong analytics platform; it also diminishes your budget, frustrates your teams, and provides incorrect insights.
Choosing the right data analytics tool is even more complicated in 2026, with additional features to consider, such as AI-powered assistants, cloud-native stacks, and compliance requirements.
In this article, we will examine the various tools companies utilize to analyze data. Our teams have helped everyone from small startups to massive enterprises figure out what is best for them and have seen what works, from business intelligence to AI-driven predictive analytics.
In some cases, our developers have even helped companies create tools of their own to deal with particularly complex data and niche situations.
If you need assistance choosing the right platform, integrating it correctly, setting up data visualization tools, or creating a custom tool, we can help.

What Are Data Analysis Tools?
Before looking at the tools available, we need to clarify what is meant by data analysis tools.
Definition and core functions
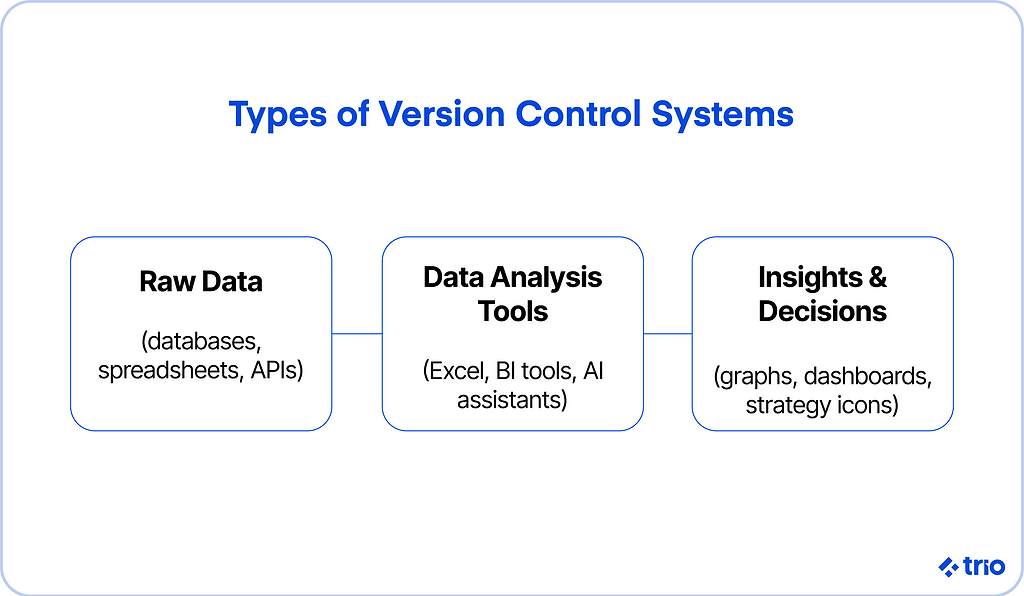
A tool for data analysis will generally consist of software that helps you collect raw data, process it into a usable format, and then interpret it.
Most data analytics platforms also feature a dashboard of some sort, allowing you to visualize data.
The simplest form would be a tool like Excel, where you use formulas for statistical analysis. In contrast, AI tools have the most advanced analytics capabilities and can even assist with projections.
Why they matter for businesses and analysts
Raw data is not particularly helpful for making real-world decisions.
Data analysis tools transform raw data into meaningful insights, enabling teams to adjust their approaches.
Some of the most common uses include campaign optimization in marketing, risk management in finance, and company-wide decision-making for executive teams.
Different categories of data analysis tools
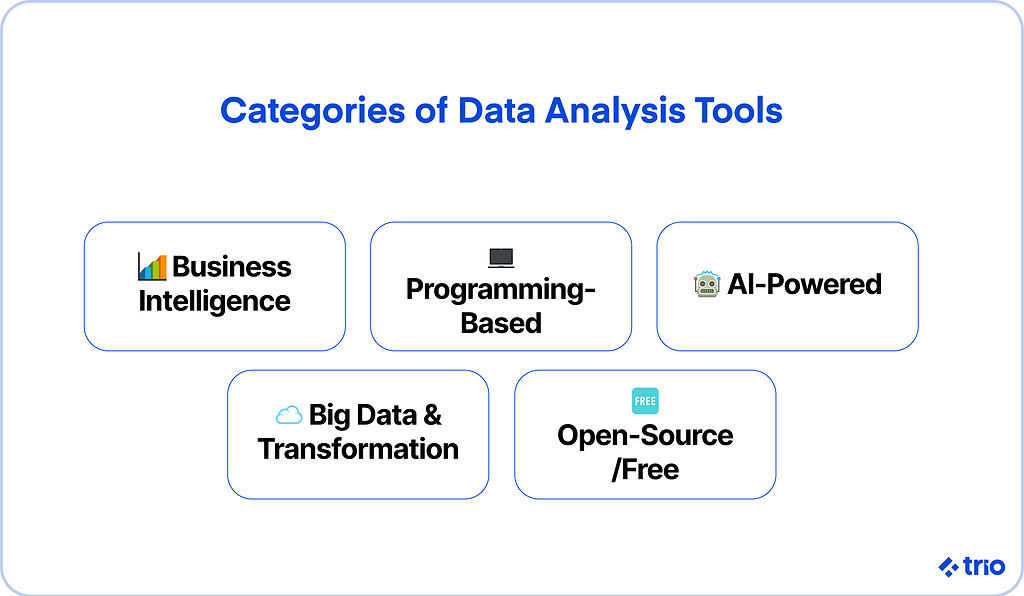
You can, very broadly, classify these tools into five categories:
- Business intelligence
- Programming-based
- AI-Powered
- Big data and transformation
- Open-source/free
We’ll explore examples of each of these categories in greater detail below.

How to Choose the Best Data Analysis Tool in 2026
Trial and error is a waste of both time and money. Approaching the world of data analysis more deliberately can help ensure your early success.
Key factors to consider
Start by considering several factors. Your data sources, the skill level of your data scientists, your budget, and any relevant regulations you are subject to will all play a role in your decision.
For example, those who rely on a large amount of data from Google Analytics may benefit from something like Looker Studio. Still, if you want something incredibly customizable, you might wish to use something created with Python or R.
There are plenty of open-source platforms available. They are a great option if you are a startup with a smaller budget, but may not have all the features you need in the long term.
Above all, consider how you are dealing with the information in relation to regulations. Do the platforms give you the ability to prioritize audit logs, access control, and maintain certifications?
When to use AI data analysts vs traditional BI
AI-powered statistical analysis software can process real-time data, providing instant insight. These days, we’ve also seen a rise in natural language queries in these tools.
However, if you are working with very sensitive or complex tasks, it can be challenging to double-check the information provided by the AI.
This is a popular data analysis strategy that facilitates exploration and rapid prototyping, but it can be challenging to implement in compliance-heavy industries such as fintech or healthcare.
Traditional BI, where a team of data professionals manually handles everything, still has its place, but it is quickly becoming outdated. We’ll likely see a lot more of it in the next few years, particularly in industries where automation and AI are not yet viable.
Role-based recommendations
Your team will play a significant role in your decision, as we mentioned earlier.
While we can help you assemble the right team, you still need to assess the skills of your existing developers.
Beginners to business intelligence and analytics will find platforms like Excel and Google Sheets to be the easiest to use. You can pair this with free training to maximize the benefits of this type of analysis.
If you are working with a team of marketers who are not necessarily code-savvy, something like Looker Studio integrates seamlessly with ad platforms and makes campaign reporting relatively simple.
Data scientists can use Python, R, and Jupyter notebooks to create incredibly flexible systems. But mistakes can be costly.
Enterprises with extensive resources and large teams accustomed to working with massive amounts of data for informed decision-making and strategy development should consider tools like Qlik, Looker, or SAS. The utmost priority in these cases is governance and scale, with your existing team being considered secondarily.
14 Top Data Analysis Tools in 2026
Now that you have a good idea of what you need to look out for, let’s look at the top tools data analysts use to provide valuable insights.
1. Python
The Python programming language is widely used to create data analysis tools, and is even used in individual cases where manual data cleaning is repetitive and can be automated.
Part of the reason why it is so popular is that it has a rich ecosystem of libraries, like pandas, NumPy, scikit-learn, matplotlib, and many more.
It is flexible enough to be used in a wide variety of scenarios. However, you need programming skills, along with knowledge of things like version control.
2. R
R, another programming language, is widely used in academia and statistics.
Packages like ggplot2 and dplyr are great for visualization and advanced analytics.
The reason it isn’t more popular is that it has an incredibly steep learning curve. R also doesn’t integrate well with enterprise BI stacks. And, like Python, this programming-based model requires a knowledge of other programming principles.
3. Microsoft Excel
Excel is widely used across various industries. It is free to use online for individuals, which makes it incredibly popular in education systems, and most people are familiar with how to use it to visualize existing data through PivotTables, Power Query, and other built-in charts.
It’s a good option if you need to perform data analysis on a smaller amount of information, but it doesn’t work well for large-scale data. It also doesn’t have any built-in governed reporting.
Using it offline can also get expensive, with a personal yearly subscription to Excel costing $179.99 for a single device.
4. SQL
SQL, or Structured Query Language, is the backbone of most analysis workflows, allowing for direct querying of relational databases and data warehouses, such as BigQuery, Snowflake, and Redshift.
It is the only tool to extract insights, though, and doesn’t completely replace other BI and AI tools.
It is technically free, but you will need a database management system. There are some cost-free options like Microsoft SQL Server Express, but fees can vary greatly depending on your needs.
5. Power BI
Power BI is a Microsoft product. It’s ideal for data integration from Excel, Azure, and enterprise security frameworks.
It is relatively simple to use, thanks to its drag-and-drop format, but if you want to get into the more advanced features, they can have a steeper learning curve.
Its extensive capabilities, DAX formulas, and governance features all make it ideal for established organizations and professionals who take analytics seriously.
The free version is great for learning, but it doesn’t allow you to share reports. That functionality starts at $14 a user/month.
6. Tableau
Tableau is one of the most popular BI tools on the market at the moment. Like Power BI, it has a drag-and-drop interface. It is most popular for its advanced visualization capabilities, though.
It is great with very large datasets in non-Microsoft ecosystems!
The biggest downside is the cost. Even viewers are billed at $15 per user/month in their standard edition, and $35 per user/month for their enterprise edition.
7. Looker and Looker Studio
Looker and Looker Studio are both Google products for analytics.
Looker is an enterprise platform that offers advanced data modeling, governance tools, and more. Costs vary depending on the size of your team and the number of query-based and administrative API calls you expect in a month.
Looker Studio is a free tool aimed at data visualization.
8. Qlik
Qlik is another popular data visualization and BI tool. The company seems to be focusing heavily on AI-powered analytics, and allows you to explore data patterns without rigid query paths.
It has quite a steep learning curve, though, and it is quite expensive, with the most basic plan starting at $200/month for 10 users.
9. KNIME
KNIME is another open-source platform. It aims to be a visualization platform with very little barrier to entry, thanks to the lack of costs and the code-free environment.
For larger deployments, you might need to upgrade to the Enterprise options, though, which require more technical expertise.
10. Apache Spark
Apache Spark is another open-source option. The unified analytics engine is designed for large-scale workloads.
It is a great option to consider if you outgrow Excel or other free tools, but don’t necessarily have a very large budget.
Distributed processing is where Apache Spark really shines, making it ideal for big data teams. In most cases, it’s a bit overkill if you are a small business.
11. dbt (Data Build Tool)
dbt (Data Build Tool) is used largely for data manipulation. It enables analysts and data engineers to transform data within the stack, allowing you to prepare warehouse data for analysis.
It’s great, but doesn’t really work as a standalone solution. The open-source tool needs a trained professional.
12. Jupyter Notebook and Observable (Notebook Environments)
Jupyter Notebook and Observable are both notebook environments. The former is the standard for code-heavy analysis, such as the kind you create when developing custom software with Python or R. It supports both of these languages and others through kernels, making it particularly well-suited for machine learning.
Its reproducibility is also sought-after, and since it is modular, you can add extensions to expand your workflows.
Obervable, on the other hand, focuses on web-based collaboration and is a great option for interactive dashboards and collaborations. But, since it’s web-based, it can’t deal with as much as Jupyter.
Regardless of which you go with, remember that they will require strong technical skills.
13. SAS
SAS, or Statistical Analysis System, is great for all things data and AI. It is a complete platform that facilitates the entire workflow, from accessing and preparing data to governance.
It is an incredible tool, offering no-code, low-code, and code options, allowing you to balance customizability and ease of use to fit your team.
14. RapidMiner
Altair’s Rapid Miner connects different data sources and uses AI to provide insights. It is a great option for academics and is truly unmatched in terms of scalability.
The only potential issue is software licensing, which seems to be determined on a case-by-case basis and can be as much as several thousand dollars per user per year.
Best Free and Open-Source Data Analysis Tools
The best free and open-source options include Python, R, Jupyter, KNIME, and Observable.
These options offer low-barrier entry points, and many of them are highly customizable, making them an ideal choice for small companies, startups, or independent analysts.
However, they do require a fair amount of technical knowledge and don’t automatically take care of security and regulatory compliance.
There is a reason paid options are so popular; however, if they aren’t in your budget, they can still be useful.
Pricing and Total Cost of Ownership
We have already covered some basic costs above. However, it is essential to note that software licenses are only one aspect that requires a monetary commitment.
Even free tools may have some costs associated with training, onboarding, and custom integrations. In many cases, training resources are included in paid B tools. However, to stay relevant with that free training, you may need to continue paying for a subscription-based model.
Hardware costs can also add up. The trend towards cloud deployment has largely arisen due to reduced costs, but you still need to consider the costs of cloud storage and computing. You also have less control without on-premise infrastructure.
Finally, unless you have used the software in a similar situation before, you may encounter unexpected expenses related to third-party connectors, security add-ons, and compliance features.
Security, Compliance, and Governance Considerations in Data Analytics Tools
Data security is far from optional. It should play a major role in your tool consideration.
There are certifications out there that you can look for. However, in most cases, your implementation will be a key factor in achieving regulatory compliance.
When you work with data that users may not want everyone to have access to, you need to have role-based access controls in place. This will ensure that only certain people have access to the information.
Also, consider how you can gather all the necessary information for compliance in various regions. In most cases, this includes audit logs, version history, and being able to show that you can reproduce results. The latter is particularly important when you use AI.
Real-World Use Cases by Role
If you need help, certain industries require very specific insights into their data, leading to the recurring use of specialized tools within the industry.
- Finance and FP&A teams:Finance teams require regulatory compliance and tools such as version control. Power BI and Tableau are good options, and both facilitate variance analysis and scenario planning.
- Marketing and growth analytics: Marketers typically require campaign reporting and seamless integration with various data sources. They often end up using platform-specific tools, such as Google Ads and GA4, or AI tools built into their CRM software. Looker Studio is a great option if they want something centralized, thanks to its AI copilot.
- Data science and engineering teams: These teams often require flexibility, rather than polished dashboards. This means they end of using Python, R, Jupyter, and dbt as the backbone of their data models.
- Executive and leadership dashboards: Clarity and projections are important here. Tableau, Power BI, and Looker offer simple dashboards that can visualize business data. The AI copilots can also be used by data analysts to formulate projections.
Common Mistakes to Avoid When Choosing Data Analysis Tools
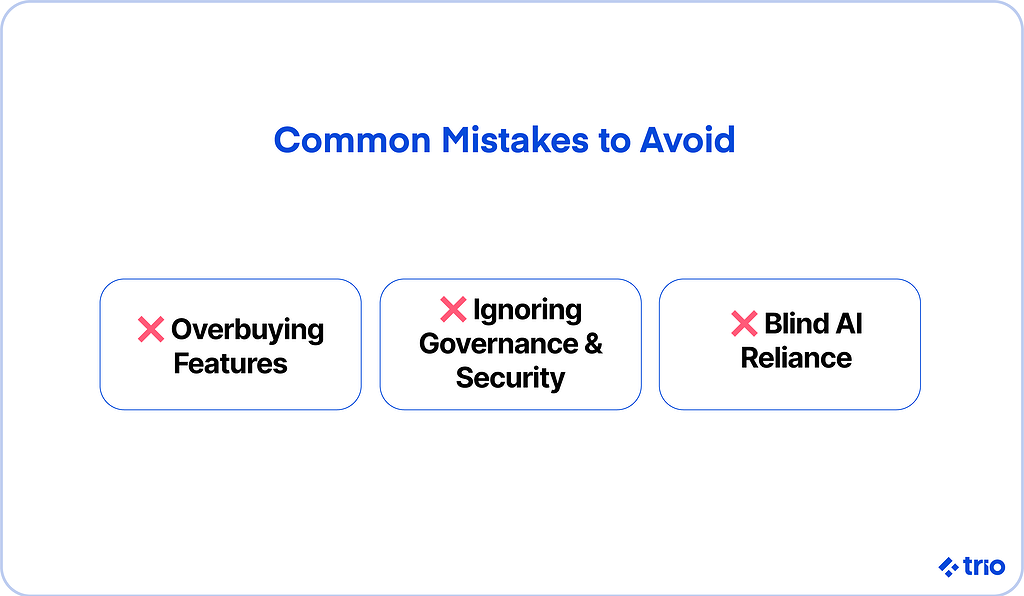
One of the most common mistakes we have seen clients make is committing to a data analytics platform that provides all the features, without considering where they actually need insights from their data.
Overbuying features that seem interesting can quickly become expensive. In reality, you will likely never use any of them in a practical sense. It’s best to decide your requirements before you start looking for a tool, or before you decide to start building.
Another common and costly mistake is ignoring governance and security. You are setting yourself up for failure, risking fines, breaches, and even losing clients when they realize their trust has been breached. It can also hinder your expansion, as some regions are more stringent than others regarding the storage and handling of data.
Finally, a recent issue that has been cropping up more frequently is the use of AI and automation with no way to oversee the steps taken by the software. These new tools are incredibly powerful and can be a great benefit in everything from data exploration and discovery to real-time issue detection, but they are not infallible.
If you are using AI-powered tools, even for automated data preparation, ensure that a human with the necessary knowledge and skills can validate the outputs, especially if you plan to use this data for decision-making.
Our developers are placed based on their previous experience. If you partner with Trio in your hiring, you will get a valuable team member who knows what they are doing and can prevent common pitfalls while implementing a variety of best practices.
Having the right person gives you speed and accuracy, whether you are integrating different data analysis tools or creating something custom to deal with data from various sources.
Reach out to connect with us so that we can assist with your next steps in hiring.

FAQs
What is the most widely used data analysis tool in 2026?
The most widely used data analysis tool in 2026 is likely still Excel, but Python and Power BI are growing rapidly in professional settings where the goal is to utilize data for informed decision-making.
Which data analysis tools are free to use?
Python, R, Jupyter, KNIME, and Observable are all free data analysis tools. There are many other tools that offer free tiers, with limited capabilities.
What’s the difference between Power BI and Tableau?
The most significant difference between Power BI and Tableau is that Power BI is a robust business intelligence and data analysis tool that integrates seamlessly with Microsoft’s ecosystems, whereas Tableau is a data visualization tool.
Do small businesses need advanced data analysis tools?
Small businesses often don’t require advanced data analysis tools. In most cases, beginner-friendly tools like Looker Studio and Google Analytics are more than enough.