

 Read Client Stories





 Alex Kugell
 Key Takeaways
- The four DORA metrics (Deployment Frequency, Lead Time for Changes, Change Failure Rate, Failed Deployment Recovery Time) remain the industry standard in 2026, though most serious engineering-intelligence platforms now pair them with a dedicated AI-measurement layer rather than treating AI as a footnote.
- Lines of code, commit count, and story points completed are activity metrics, not KPIs. They measure motion, not direction, and get gamed the moment they become targets.
- Fintech teams need a compliance layer on top of the standard engineering KPIs like downtime minutes, including coverage on compliance-critical code paths specifically, security vulnerability lead time, and incident impact measured in financial and regulatory terms.
- AI-assisted development has changed how several of these metrics behave, sometimes legitimately, sometimes by inflating activity without inflating value delivered. You need to read the numbers with that in mind rather than against a pre-AI baseline.
- Velocity remains genuinely useful for sprint planning, but only after three or more sprints of historical data, and it should never be the basis for comparing one team against another.
Most engineering teams have a dashboard somewhere: velocity graphs, commit counts, Jira ticket closures, maybe a burndown chart nobody quite trusts anymore.
The problem shows up when those metrics stop driving decisions, either because the wrong things are being measured, or because too much is being measured and nobody opens the dashboard anymore.
Sometimes the metric itself becomes the target, and a team optimizes for the number instead of the behavior behind it. Velocity looks healthy while technical debt quietly piles up underneath it.
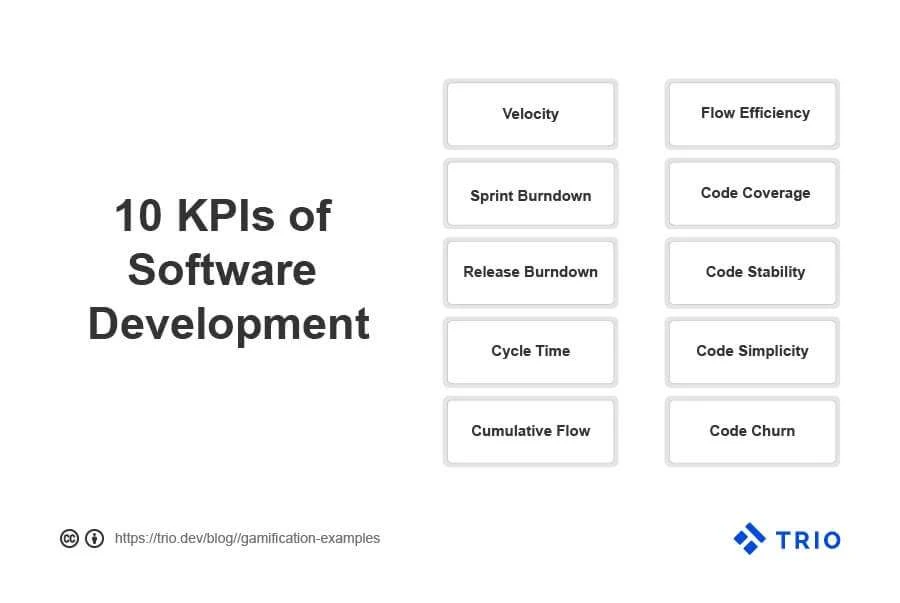
The right KPIs for a fintech team reflect delivery speed, system stability, code quality, and compliance health at the same time. This covers ten that do that, plus the two that only matter once engineers stop being employees and start being placed by an external partner.
But none of that matters without the right people executing against it. Finding a fintech developer with real production experience can take months. At Trio, we pre-vet for fintech expertise, so placement can happen in as little as 3-5 days.
1. Deployment Frequency
Deployment frequency measures how often a team successfully ships code to production. High frequency generally signals mature CI/CD automation, smaller batch sizes, and a culture comfortable shipping incremental change rather than infrequent, large releases.
The DORA research framework, built on data across thousands of engineering organizations, classifies elite performers as teams deploying on demand, multiple times a day.
In practice, high performers land between once a day and once a week; medium performers sit between once a week and once a month; low performers deploy less than monthly.
For fintech teams, deployment frequency carries a compliance dimension that general engineering advice skips entirely.
Every deployment inside a PCI DSS-scoped environment should trigger a documented change management record, and regulatory frameworks (including the EU’s DORA, the Digital Operational Resilience Act, not to be confused with the engineering measurement framework of the same name) increasingly expect evidence of controlled change processes.
A team deploying frequently without documented change controls can be creating compliance exposure while looking like a strong performer on this exact metric.
Deployment frequency numbers have also been moving as AI coding tools generate a larger share of committed code. A sudden jump here might reflect genuine productivity gains, or it might reflect smaller, more fragmented changes that don’t represent proportionally more value.
2. Lead Time for Changes
Lead time for changes measures the time from commit to that code running in production.
Shorter lead times generally enable faster iteration and more responsive product development. DORA’s elite benchmark sits under one hour.
In fintech specifically, lead time is most revealing when broken down by change type.
A patch to a vulnerability in a payment processing module should have close to zero lead time, since the goal is minimizing the exposure window, not hitting a general SLA.
Lead time also exposes bottlenecks unique to regulated environments, such as legal review steps, compliance sign-off gates, and penetration testing cycles.
Tracking where the time actually goes (development, code review, compliance review, or deployment) tells you which part of the process is actually worth fixing.
3. Change Failure Rate
Change failure rate measures the percentage of deployments resulting in a production incident, a rollback, or a hotfix.
Think of it as the quality counterweight to deployment frequency. A team deploying constantly while breaking production constantly isn’t performing well on either axis, whatever the dashboard implies.
Elite DORA performers keep this below 5%. A change failure rate above 15% in a payment-critical system deserves immediate attention, since failures in payment rails carry direct financial and regulatory consequences.
A failed deployment that briefly processes transactions incorrectly can trigger reconciliation errors, customer complaints, and regulatory reporting obligations depending on jurisdiction.
The most useful version of this metric tracks which change types actually fail. Integration changes with third-party financial APIs, schema migrations on transaction tables, and edits to compliance rule engines tend to carry higher failure rates than UI changes in most fintech codebases.
Knowing that pattern is what tells you where to actually spend testing investment.
4. Failed Deployment Recovery Time
Previously known as Mean Time to Recovery (MTTR), this metric was refined by DORA’s research team in 2023 to focus specifically on incidents caused by software changes, rather than external factors like infrastructure outages.
It measures how long it takes to restore service after a deployment causes a production failure.
For fintech, recovery time carries consequences that most general software companies don’t face in the same way. A 30-minute payment outage is a customer experience problem and, in some jurisdictions, a potential regulatory reporting trigger.
The SLA here is frequently set by a regulator or banking partner, not by engineering preference.
It’s worth tracking two related, more granular signals alongside recovery time itself, since lumping them together hides where the actual delay lives: mean time to detect (how long between the incident occurring and the team noticing it, a direct read on observability) and mean time to acknowledge (how long between detection and someone actually starting to work the incident, which usually reveals either alert fatigue or unclear ownership).
A slow MTTR caused by a slow detection problem needs a completely different fix than one caused by a slow response problem, and averaging them together obscures which one you have.
The practical levers for improving all three are the same, consisting of better observability, clear incident ownership, and automated rollback capability that doesn’t require someone to be awake and available at 3 am.
5. Code Coverage
Code coverage measures what percentage of source code actually executes during testing.
Higher coverage generally means fewer undetected bugs reaching production, though the relationship isn’t perfectly linear. 100% coverage doesn’t guarantee correctness, and coverage on the wrong code paths provides false confidence dressed up as a good number.
Code coverage on compliance-critical paths deserves entirely separate tracking from overall coverage.
A fintech codebase might show 75% overall coverage while the AML screening logic, the fraud scoring engine, or the transaction ledger reconciliation module sits at 40%.
The bugs most likely to create regulatory exposure aren’t distributed evenly across a codebase. They concentrate precisely in the modules handling money movement and compliance reporting, which is exactly where the aggregate number tends to hide them.
6. Cycle Time
Cycle time measures total elapsed time from when work on a task begins to when it’s delivered, distinct from lead time, which starts at commit. It captures everything, including time spent waiting, blocked, or in review, not just active development time.
Cycle time earns its keep in the review step specifically.
A KYC workflow change or a payment routing update might spend two hours in active development and three days waiting on compliance review or a security assessment. That gap is what cycle time surfaces and lead time alone would miss.
The most useful way to look at this data is the distribution, not the average. If most tasks land in two or three days but a handful stretch to two weeks, those outliers usually share a common root cause worth finding.
7. Sprint Velocity
Velocity measures how much work a team completes within a sprint, typically in story points.
Our developers like to use this primarily as a planning tool, after they have been able to gather information over three or more sprints, and your team’s average velocity becomes a reasonable estimate of what they can realistically commit to in future sprints.
It is not a performance metric, though.
A team with a velocity of 60 isn’t outperforming a team with a velocity of 30, since story points aren’t standardized across teams. Comparing velocity across teams, or using it to judge whether people are working hard enough, reliably produces inflated estimates and little else.
Velocity becomes genuinely useful when tracked against a team’s own trajectory over time. A sustained decline against stable scope is a real signal of accumulating technical debt, team churn, or an external dependency creating drag, and is worth investigating rather than ignoring.
8. Code Churn
Code churn measures how often recently written code gets rewritten or deleted shortly after being committed. High churn suggests a team is getting requirements wrong, discovering design issues post-ship, or working under enough pressure to skip proper design upfront.
For fintech teams, churn in specific modules is a far more useful signal than churn measured in aggregate.
High churn in UI components is low-risk. Iteration there is normal and expected. High churn in payment processing logic, ledger code, or compliance rules is a different signal entirely, and usually a more urgent one.
One added wrinkle is that regulatory change can drive legitimate high churn in compliance modules when a new rule takes effect.
A PCI DSS update or a new local regulation might require significant, compressed-timeline rewrites of compliance-adjacent code, and that kind of churn is simply the system working as intended.
9. Security Vulnerability Lead Time
Security vulnerability lead time measures the average time from identifying a vulnerability to deploying a fix in production.
It overlaps conceptually with lead time for changes, but tracking it separately is worth the extra dashboard tile.
The window between discovery and remediation is a window of regulatory risk. PCI DSS requires critical vulnerabilities addressed within 30 days of discovery, and many mature fintech security programs target considerably shorter cycles for anything rated critical severity.
Security fixes typically travel a different path through the development process than feature work. They bypass the normal prioritization queue, require emergency change management, and often need coordination with external parties like payment networks or banking partners.
10. Incident Impact: Financial and Regulatory Consequences
Incident impact is qualitative to define but quantitative in consequence.
The most useful approach that we have encountered classifies incidents by the financial value of affected transactions, whether they triggered any regulatory reporting obligation or caused reconciliation errors needing manual remediation, and whether they touched any SLA with a banking partner or payment network.
This is less a dashboard metric and more a conversation metric, since it’s what actually connects engineering performance to the outcomes fintech leadership and regulators care about.
Related Reading: Fintech Hiring Slowdown
KPIs for Teams Working With External Partners
Fintech teams using staff augmentation or external engineering partners need two additional signals beyond the standard set above.
The usual KPIs (deployment frequency, lead time, coverage targets) still apply, but don’t capture everything that matters when the engineer wasn’t hired directly.
Ramp time to productive contribution measures how long it takes a newly placed engineer to contribute production code, participate in code review, and operate independently inside the team’s workflows.
Knowledge transfer completeness tracks whether domain knowledge about compliance-critical systems is actually distributed across the team, or concentrated in one or two individuals who happen to know where the bodies are buried.
Both matter more in fintech than elsewhere: developers who already understand the regulatory and security requirements of financial technology contribute meaningfully faster, and they know what needs to be documented so the team retains full context after they leave.
Finding developers like that can take months on your own. At Trio, we’ve already found and vetted them, so placement can happen in as little as 3-5 days.