


 Read Client Stories




 Alex Kugell

 Key Takeaways
- Python is widely used in finance for data analysis, financial modeling, algorithmic trading, risk management, and machine learning.
- Libraries like Pandas, NumPy, Matplotlib, and Seaborn handle most of the heavy lifting. For financial data retrieval specifically, yfinance pulls real-time and historical stock data directly from Yahoo Finance.
- Python’s advantage over Excel is most pronounced for automation, statistical modeling, and working with large datasets.
- Fintech teams use Python for production systems like fraud detection models, reconciliation pipelines, and real-time risk engines.
- The basics of Python are learnable in a few weeks.
Financial teams need to process massive amounts of data, sometimes almost instantly, to make accurate decisions. Spreadsheets don't allow this. So how is Python used in finance, and why do organizations reach for it to keep up with the scale and complexity of modern fintech environments?
According to the Stack Overflow Developer Survey, the adoption of the Python programming language has accelerated drastically over the past few years, and its dominance in the finance industry reflects just how well it fits into these data-heavy workflows.
Python's vast ecosystem of financial libraries, combined with its simple syntax and readable, high-level code, makes it accessible to many non-technical finance professionals, too.
And, it manages to do this without sacrificing the depth that financial analysts and quantitative researchers need. Few other programming languages manage that balance as well.
Let’s look at the main ways Python is used in finance and the libraries that make it possible, including where Python likely fits into your own team’s workflows today.
If you need senior fintech developers with many years of production experience in Python, we can help.
Our pre-vetted developers can be onboarded in as little as 3-5 days, depending on your requirements.
Why Is Python Widely Used by the Financial Industry?
The finance industry operates in a fast, competitive, and heavily regulated environment.
Factors like time-to-market matter a great deal, making efficiency and ease of use critical in any technological tool a team adopts.
Python is widely used for financial work because of that.
Here are the most significant advantages it brings to fintech teams specifically:
Faster Time-To-Market
Python’s flexible and scalable code enables developers to quickly build a minimum viable product (MVP) and test its efficacy on an existing market problem.
Companies using Python no longer need months of work to test the waters with a new idea, but can get the basic features out in a fraction of that time.
Once they’ve validated their MVP, they can modify and refine it quickly, thanks to Python’s clean, performant nature.
This speed also means that they can work through iteration cycles faster, which is a genuine competitive advantage in fintech, where regulatory deadlines and market windows don’t wait.
Readability and Simplicity
Python was designed with readability in mind.
Its syntax resembles plain English fairly closely, so most developers pick it up quickly. Since it’s so easy to read, you also reduce error rates, which is critical in heavily regulated industries where mistakes can become compliance findings.
This simplicity also helps considerably when designing complicated financial models. Python 3 in particular offers concise code well-suited to deploying large financial applications.
A Library Ecosystem Built for Finance
Fintech developers don’t need to design financial applications from the ground up.
Instead, Python libraries make the job tractable with a rich collection of standard and third-party packages and tools.
If you are trying to automate financial data analysis, which involves statistical models, algorithms, machine learning, and complex mathematical concepts, Python provides these through a library ecosystem that surpasses other programming languages we have come across.
On top of that, because the language is so popular, there is a wealth of community support behind each package.
Community and Talent Availability
Python’s open-source codebase attracts excellent community support.
Finance professionals who learn Python gain access to a global community of practitioners sharing code, answering questions, and maintaining libraries that update as markets and data sources change.
If you are considering whether or not you should use Python for your fintech, it’s important to note that the talent pool is considerably deeper than for more specialized quantitative languages like R or MATLAB.
Versatility Across the Stack
Economists and finance professionals who work in MATLAB don’t need their models translated into Python code.
Instead, Python supports end-to-end development of financial models and solutions in a single environment. It handles prototyping and production deployment, and integrates directly with Excel, databases, APIs, and cloud infrastructure.
In practice, this means that your fintech team can run Python in a Jupyter notebook for exploratory analysis and deploy the same logic to a production pipeline without rewriting the core.
4 Core Python Applications in Fintech
Python’s use cases in fintech extend across a wide range of financial sub-verticals and data disciplines.
Here are the four most significant applications of Python in finance today.
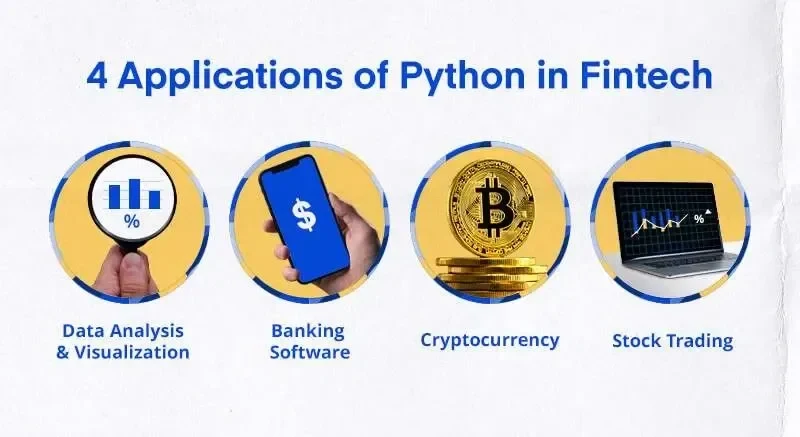
1. Financial Data Analysis and Visualization
Analyzing financial data and making sense of large and complex financial datasets, and visualizing them for predictive analytics, sits at the core of many fintech solutions.
We have already mentioned how Python libraries equip developers with data analysis and visualization, statistical analysis, and machine learning capabilities in the previous section.
The most popular libraries for these purposes among our developers are Pandas, Matplotlib, and Seaborn.
In practice, this means developers use Python to:
Pull historical and near-real-time market data with yfinance, which hands back a Pandas DataFrame ready for analysis in about two lines of code
Clean and merge large datasets across multiple sources
Visualize financial data using Matplotlib and Seaborn to produce charts that update automatically as new data arrives
Use Jupyter notebooks for exploratory financial data analysis, combining live code, outputs, and narrative in a single document.
The biggest benefit here, compared to most BI solutions, is that Python processes large datasets efficiently and scales as data volumes grow.
With Python, teams can schedule scripts to pull updated market data, process it, and generate reports in a repeatable way, greatly reducing the manual steps involved in running standard analyses.
Analysts must still define validation checks and review exceptions, but much of the mechanical work can be automated once the reporting logic is clear.
2. Python for Financial Modeling and Banking Software
Both traditional and modern banking applications rely on Python’s scalability.
Venmo, for example, uses Python for payment services. Stripe and Robinhood have both built core parts of their platforms on it.
But outside of those examples, a lot of fintechs also use Python to develop the financial modeling and backend logic that powers their financial workflows.
Python for financial modeling covers several distinct use cases:
Discounted cash flow (DCF) models and sensitivity analyses that would require complex nested Excel formulas can be written more cleanly in Python and re-run against different assumptions automatically
Monte Carlo simulations for scenario analysis and portfolio risk assessment in investment management and lending risk teams
Portfolio optimization using libraries like PyPortfolioOpt, which implements mean-variance optimization and allows finance teams to model efficient frontiers with real market data
Time-series forecasting using ARIMA or machine learning models to predict cash flows, revenue, or credit default rates
3. Cryptocurrency and Blockchain Analytics
With new players entering the cryptocurrency space regularly, the demand for market data analysis programs has grown alongside it.
Companies dependent on analyzing cryptocurrency stock prices and offering predictive financial insights need these programs to run on a daily basis.
Data analysis tools like Anaconda and many decentralized platforms on the blockchain are built on Python and its libraries.
Python’s ability to connect to exchange APIs, pull historical data, and run statistical analyses on that data also makes it the dominant language for crypto analytics work.
4. Algorithmic Trading and Quantitative Finance
We see a lot of Python used in algorithmic trading strategy design and market data predictive insights.
While it’s common to see these uses in large organizations, we have even seen it at the individual level, with people building their own predictive algorithms for trading strategies by using Python libraries that previously required expensive proprietary software.
Python used in quantitative finance typically involves:
Backtesting trading strategies against historical data using Zipline-reloaded or Backtrader
Building statistical arbitrage models that identify price discrepancies across instruments
Running portfolio optimization to balance expected returns against risk, including portfolio optimization via efficient frontier models
Automating trade execution through broker APIs, allowing strategies to run without manual intervention
TA-Lib and QuantLib cover indicators and pricing well, and zipline-reloaded handles backtesting. None of them handle live execution, order management, or the risk controls a regulated desk needs, so treat the open-source stack as the research layer rather than the whole system.
For regulated environments, Python’s audit trail capabilities and the reproducibility of Jupyter notebooks also make it easier to document trading strategy logic for compliance review.
Python vs. Excel: What Actually Changes
Microsoft Excel is still one of the most preferred tools for financial data analysis and visualization.
It’s familiar and carries a decent degree of functionality. But Python handles data better in several specific situations.
Better data import and processing: Cleaning multiple large financial datasets in Excel gets tedious fast and tends to introduce errors. Python recognizes and cleans both structured and unstructured data faster.
Powerful automation: Excel users can automate some recurring analyses using macros and scripting, but Python's scripting capabilities generally handle larger, more variable datasets and can automate the process end-to-end when procedures are clearly defined.
Easier debugging: Python provides an error message explaining what went wrong and where in the Python code the issue originated, instead of just an error notation like Excel. With comments in the code, you’ll have additional context, too.
Open-source accessibility: Excel ties you to Microsoft for feature updates and support. Python runs as a free, open-source language that a global community can update and extend.
Superior statistical and machine learning capabilities: Python provides superior tools to build advanced financial data analysis models, including machine learning models that can identify fraud patterns, predict credit risk, and classify transaction anomalies.
Advanced data visualization: Visualizing financial data effectively matters for communicating with stakeholders. Matplotlib and Seaborn create more customizable graphs and charts than Excel. Plotly adds interactivity.
Cross-platform portability: Python scripts run across platforms like Windows, macOS, and Linux, which is essential in fintech environments where data pipelines span multiple infrastructure environments.
The 10 Most Useful Python Packages for Fintech
Now that you have a good idea of how people are using Python, let’s take a more detailed look at the different packages that actually deliver on those capabilities for financial data analysis, modeling, and trading.
1. NumPy
NumPy provides one of the most foundational yet essential capabilities in Python. It introduces several mathematical and scientific computing functions to the language, which other libraries on this list build on.
This includes things like n-dimensional arrays and matrices, and basic functions to manipulate those data structures.
Virtually every numerical computation in Python that we have come across in the financial sector touches NumPy at some level.
2. SciPy
SciPy builds sophisticated financial data models on top of the basic mathematical structures NumPy provides.
Statistical models are then able to use these algorithms for tasks like clustering, interpolation, transformation, and integration.
SciPy provides developers with the advanced techniques to build predictive data models that power things like credit scoring and risk assessment.
3. Pandas
Pandas is a popular Python library known for its DataFrame and Series structures designed specifically for financial data analysis and model building.
The library handles multiple data types: tabular, multidimensional, and heterogeneous. You can also create basic visualization plots using the library.
It provides concise and powerful functions for importing and manipulating financial data, and is ultimately used in settlement files, transaction records, or market data feeds.
4. statsmodels
While SciPy provides advanced statistical tools and Pandas helps implement them, statsmodels runs more thorough testing of different statistical models.
Diagnostic results for every model appear alongside statistical packages to ensure accuracy.
For financial modeling that needs to be defensible, like credit models, risk models, or anything else that you think might show up in front of a regulator, statsmodels becomes critical.
5. yfinance
As we have briefly mentioned already, yfinance allows finance teams to pull real-time and historical stock data, options data, and fundamental financial data directly from Yahoo Finance with minimal setup.
Data from sources like Yahoo Finance arrives in a Pandas DataFrame, ready for analysis.
Worth knowing before it reaches production: yfinance is not an official Yahoo API. It reads Yahoo's public endpoints; its own README states it is intended for research and personal use, and releases have been pulled when Yahoo changed something underneath it.
Fine for analysis and prototyping, risky as a dependency in anything customer-facing.
6. Zipline
Zipline brings many of the above libraries together as an algorithmic trading library, handling data ingestion, strategy design, and backtesting.
One caveat matters more than anything else about it. Zipline came out of Quantopian, which shut down in 2020, and the original repository has been unmaintained since. Its README still advertises support for Python 2.7, and it warns that a response to an issue may take months or even years.
The maintained continuation is zipline-reloaded, which tracks current Python, pandas, and NumPy versions. Start there for anything new, and treat any tutorial still pointing at the original Quantopian package as out of date.
7. Pyfolio
Pyfolio enables fintech developers to generate tearsheets containing performance statistics pertaining to the algorithms they designed with Zipline.
Annual returns, Sharpe ratios, portfolio optimization metrics, portfolio turnover, and more are all easy, and the tearsheet format also helps with compliance documentation.
Pyfolio carries the same inheritance problem as Zipline: the Quantopian repository stopped moving after 2020, and pyfolio-reloaded is the version still being updated.
8. TA-Lib
Technical Analysis Library, or TA-Lib, works as an alternative to Zipline and Pyfolio.
The main reason you would choose this instead of the other options is that it’s a C++ library with a Python wrapper.
We often see it used in fintech teams working on market microstructure or technical signal generation because of its performance characteristics on large historical datasets.
9. QuantLib
QuantLib is another library well-suited to quantitative finance work.
Also written in C++ and exported to Python, it’s great for building tools related to modeling, trading, and risk management.
Its algorithms cover yield curve models, solvers, Monte Carlo simulations, market conventions, and more.
10. Matplotlib
While Pandas offers basic visualization tools, Matplotlib functions as a dedicated data visualization library.
It is, by far, one of the easiest Python packages to implement for financial modeling. It has extremely simple syntax and maintains extensive documentation.
How to Get Started: Learning Python for Finance
As one of the more approachable programming languages, we have found that the basics of Python are accessible in a few weeks of structured practice, and the libraries that matter most for finance have documentation written with practitioners in mind.
A practical starting point:
Learn the fundamentals: lists, dictionaries, loops, and functions.
Then learn Pandas and NumPy: These two libraries handle the vast majority of financial data manipulation tasks.
Use Jupyter notebooks for practice: The interactive format lets you run code cell by cell, see outputs immediately, and annotate your analysis.
Pull real financial data early: Data from sources like Yahoo Finance via yfinance gives you real-world financial data to work with.
Move to financial modeling once the data fundamentals feel solid: Build a simple discounted cash flow model or run a Monte Carlo simulation on a portfolio.
Conclusion
Python provides the tools that finance professionals and fintech engineering teams use to deal with massive quantities of data at near real-time speeds.
It is a great option for everyone, from an individual trying to put together an MVP quickly to a massive organization that has scaled to the point where tools like Excel are no longer viable.
If you’re looking for Python developers with fintech domain expertise for your project, we can connect you with world-class professionals thoroughly vetted for regulated environments.